D3 Exploration and Graphs
Well. Been a minute since my last post. While I intended to write something up once a week or so it has now been 99 days since the last post. That’s what happens when I’m finishing up my last year of college. Things get busy.
Either way as apart of my Advance Database Systems class I need to complete a semester project. The main requirements were relatively simple with three main options.
- Create a database that requires the management of complex data.
- Data warehousing
- NoSQL database/Big Data
I’ll probably write more about it once it’s done. But needless to say my teammate and I decided to go NoSQL. Mostly because the only requirement for this version of the project we were unsure on was what qualified “a reasonably large data for the project”. But we figured using how Wikipedia articles end up linking to each other would be large enough. Or at the very least gave us a simple dial we could adjust to get how much we needed.
But I wanted to find some interesting ways to present that data and allow it to be accessed. And due to research for a previous project I happened to run into D3.js. And this gave me the perfect excuse to tinker around with it.
Displaying Vertices and Edges
“Traditional” Graph
The problem was relatively simple I needed to effectively create a graph of vertices, which I tend to call nodes, representing the Wikipedia articles themselves. Along with edges which represent a link found within one article that leads to another.
Initially I planned on simply placing each child vertex equally spaced around the parent vertex. But that quickly turned into a large graphic beyond 60 chilren nodes off the root. And that was without taking into consideration that I planned on displaying a few layers. So I turned to anther method of placement. Which involved placing the children nodes round the root in a rather tight formation. From there each node would attempt to drift away from the node closest to it until no other nodes where within a preset radius. This offered much better density. And didn’t look to bad with a few layers.
But now a new problem arose. Depending on the number of edges and where a node ended up it was possible for you to be unable to see a node simply because it was covered up by too many edges. This could have been solved by drawing the nodes on top of course. But then it was edges to become obscured making it difficult to see what was being connected.
Hexagon Graph
With that in mind I had an idea. In general it’s rather simple. Vertices are placed at the the center of a hexagon that lies within a hexagonal grid. Then edges simply follow the edges of those hexagons until they are adjacent to the hexagon containing the connecting vertex.
This solved both of the main issues I had with my previous implementation. Which was the edges and vertecies overlapping each other. And while the edges still overlap each other it’s still possible to see distinctly whether or not it’s even possible for a pair of vertices have a connection.
Paths and the roads not traveled.
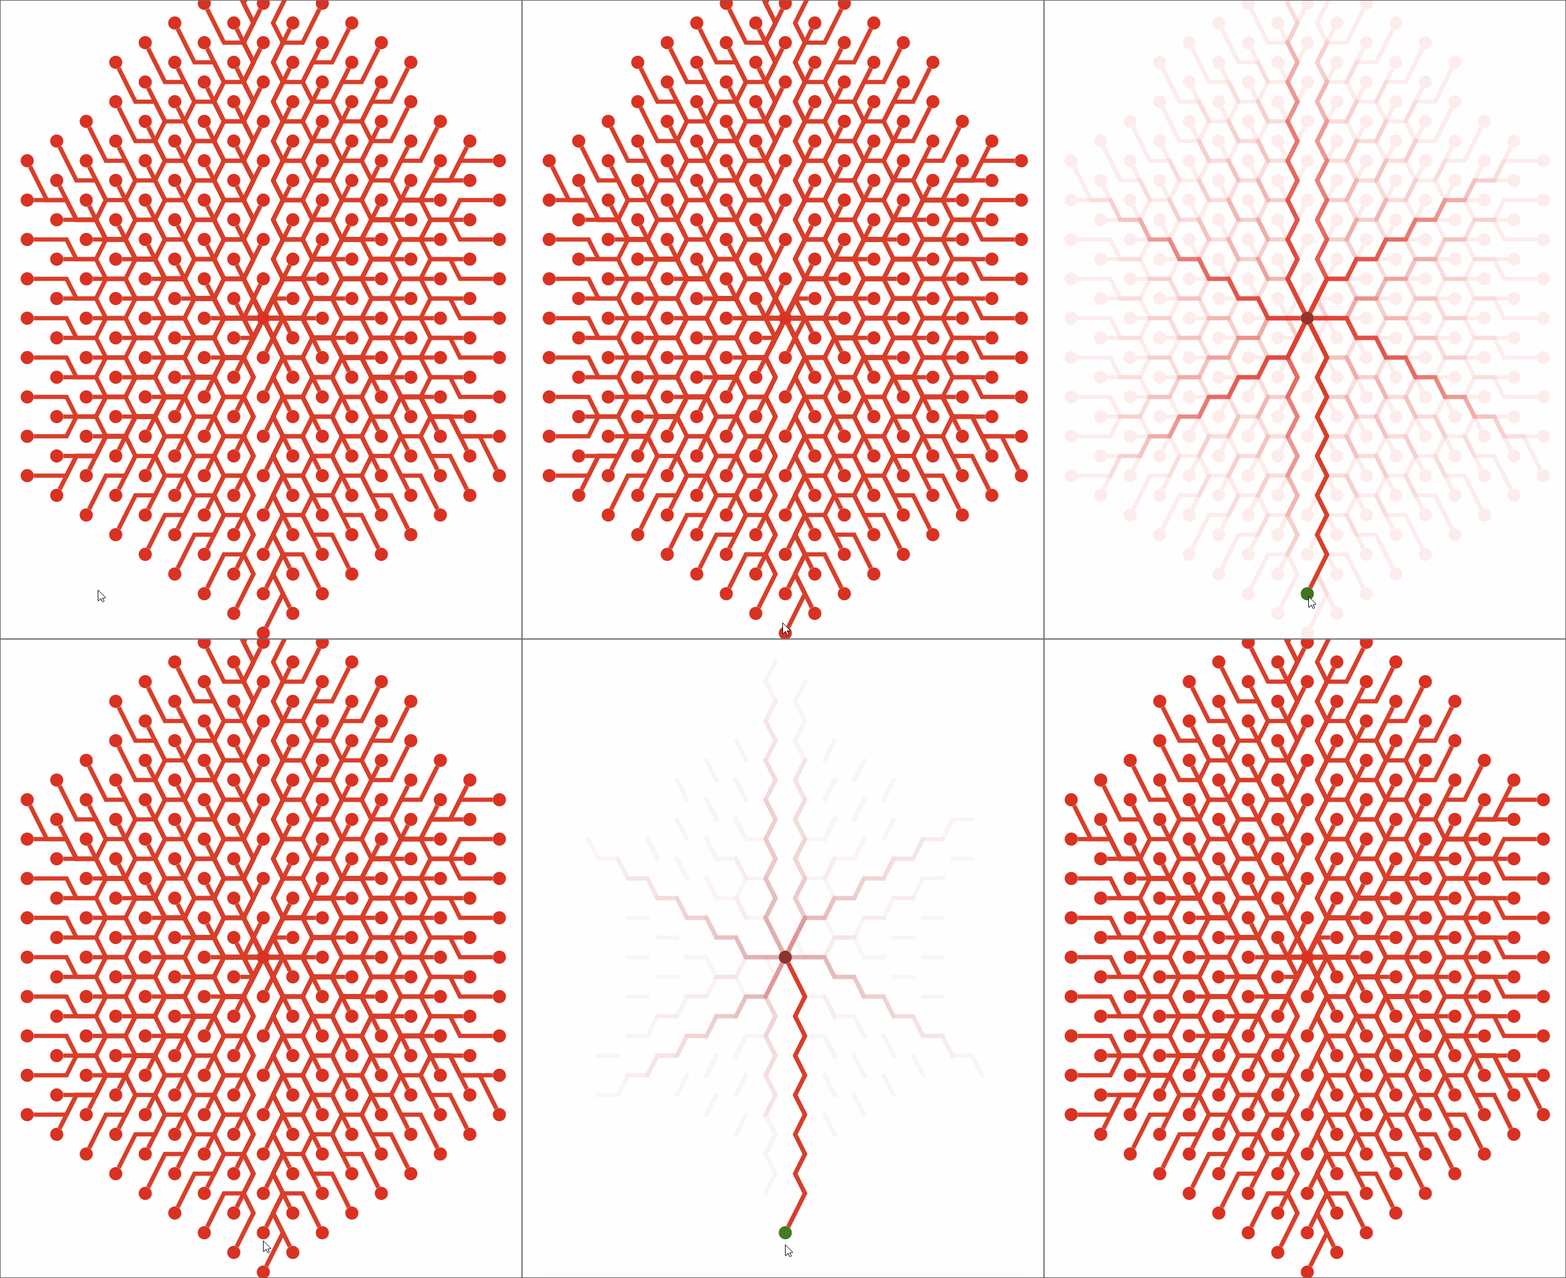
Another part of this project also involves a user actually being able to traverse this themselves. With the end result being a list of Articles they used to get from point A to point B. And I wanted a graphical representation of that as well. This was quite a bit simpler to implement than the graphs but still rather satisfying for me. The difficult part being presenting alternative routes they could have taken. Which is still rather messy. Which is why when you over over specific points it will cause certain routes to fade out. Allowing to you filter what you can see.
Conclusion
After working with D3 I definitely want to tinker around with it some more. So I’ll likely be trying to find some excuse to use it in the future.
Gallery
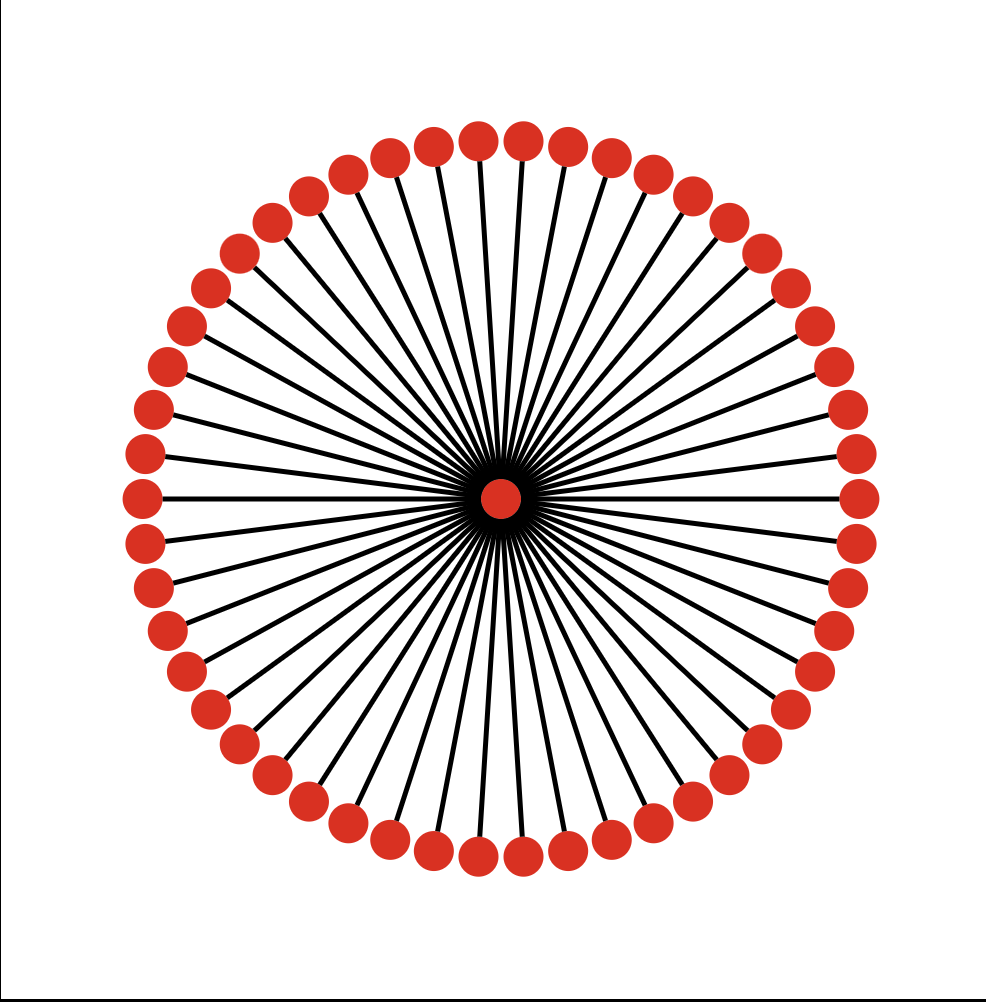
Single Root. ~52 Children. Circle Placement.
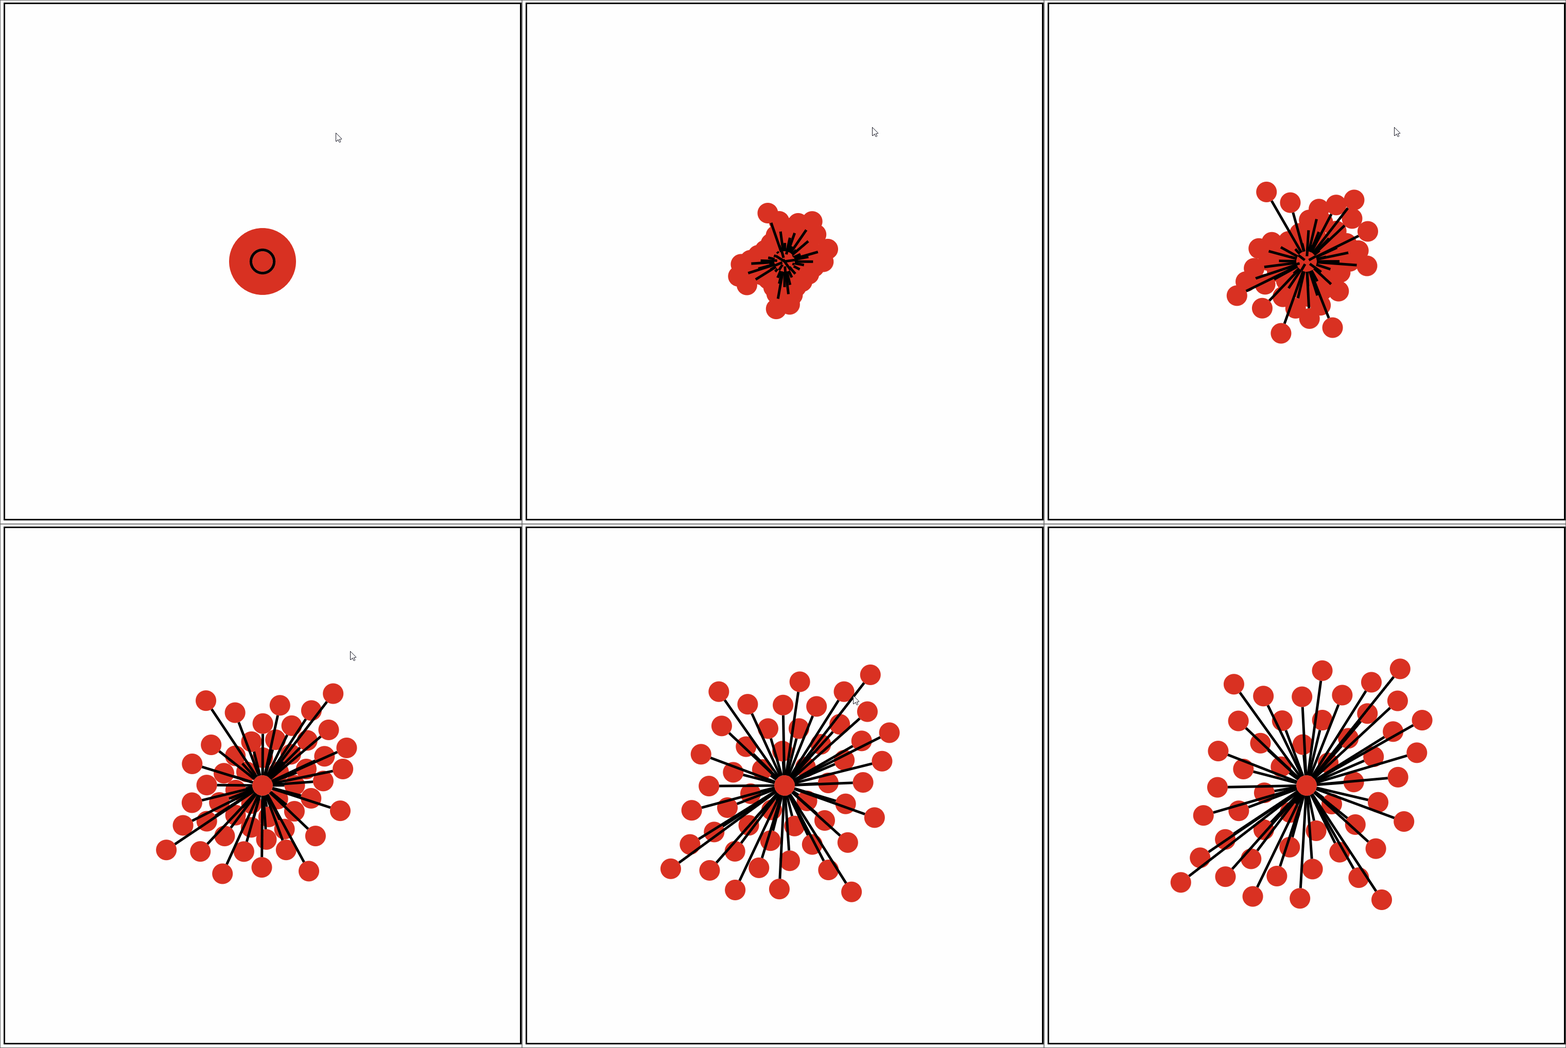
Single Root. 150+ Children
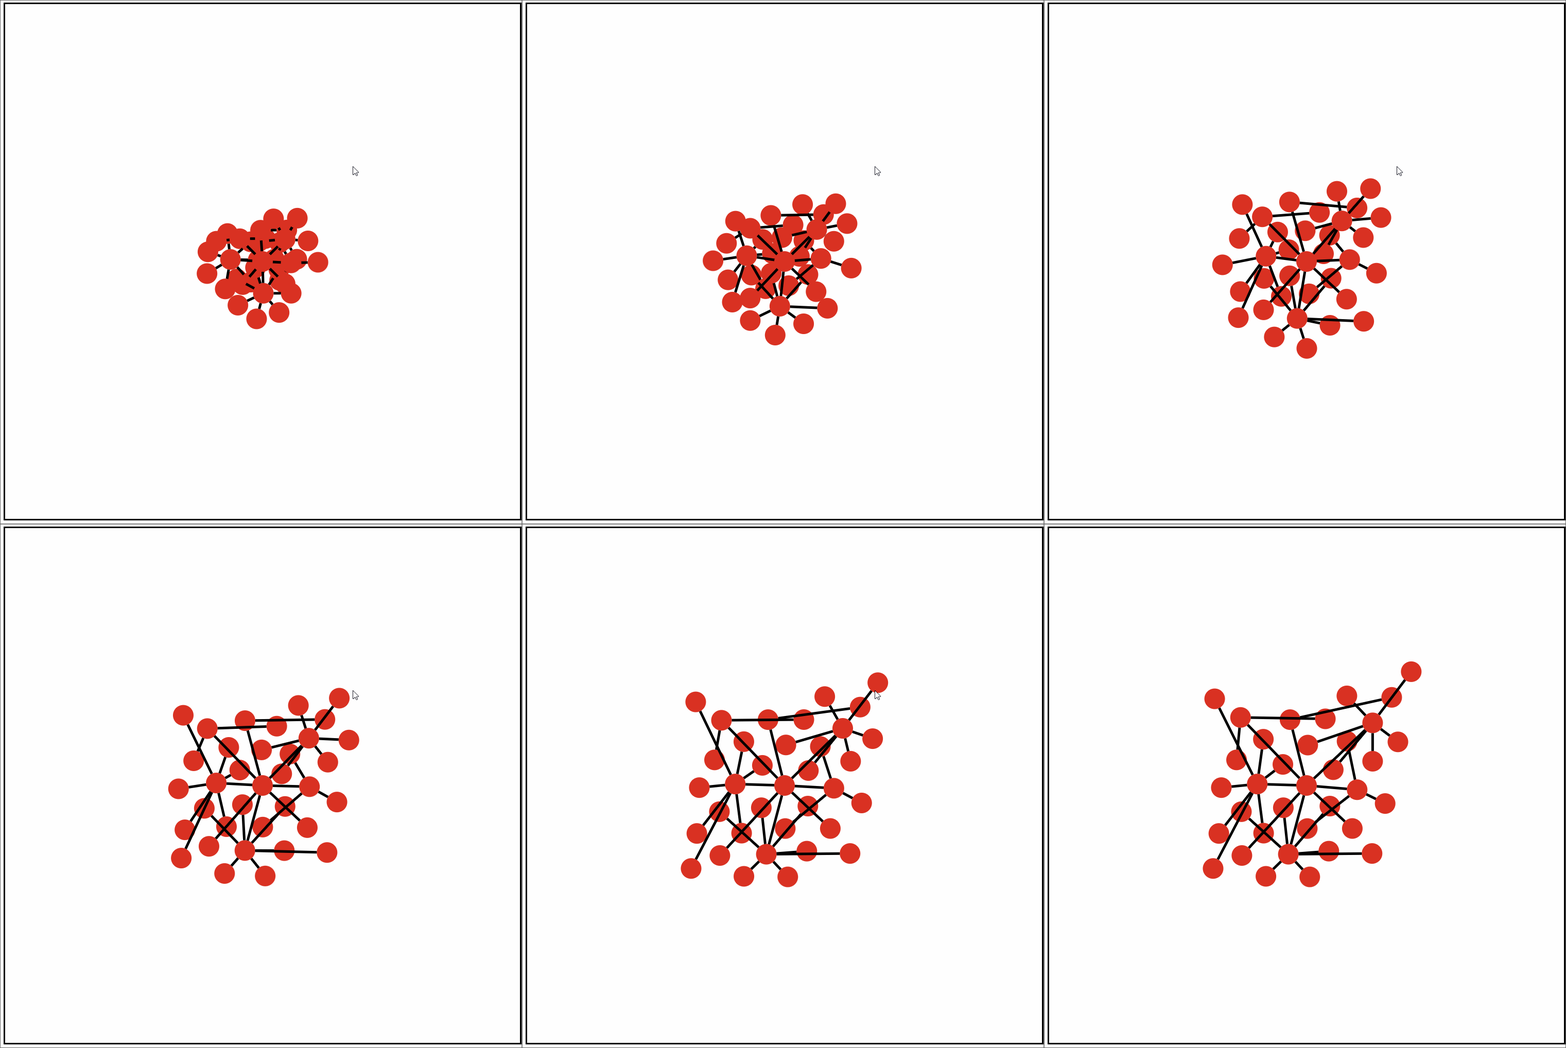
Single Root. 6 Children. 30+ Grandchildren.
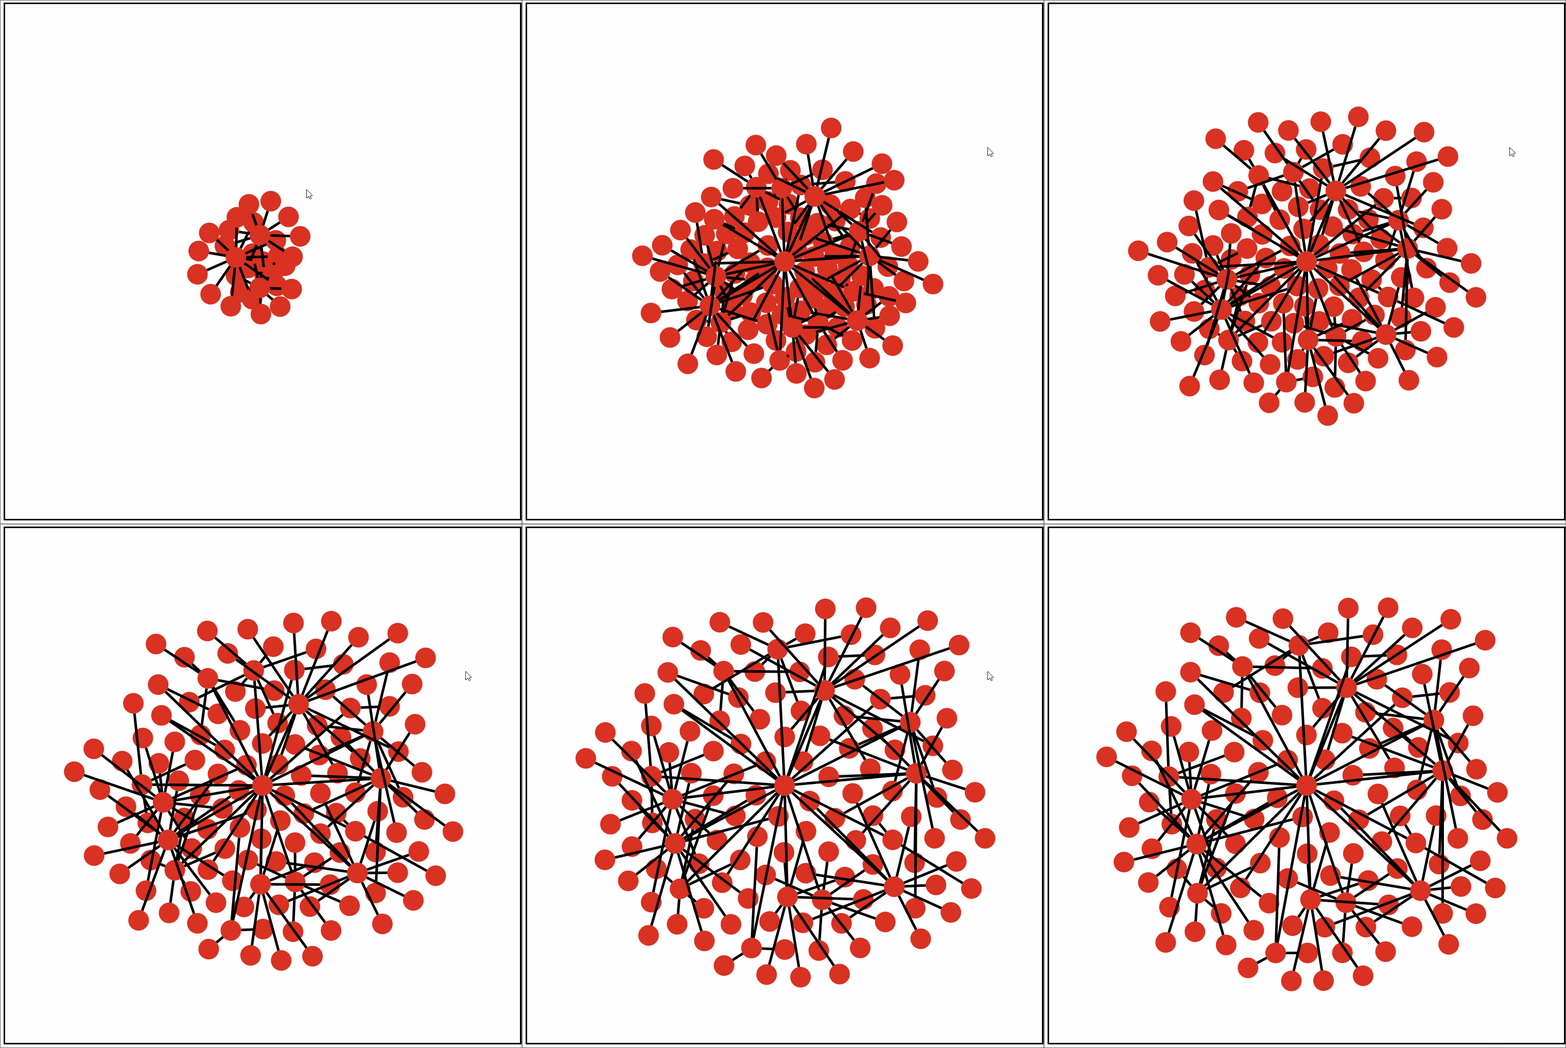
Single Root. Unknown Children/Grandchildren count
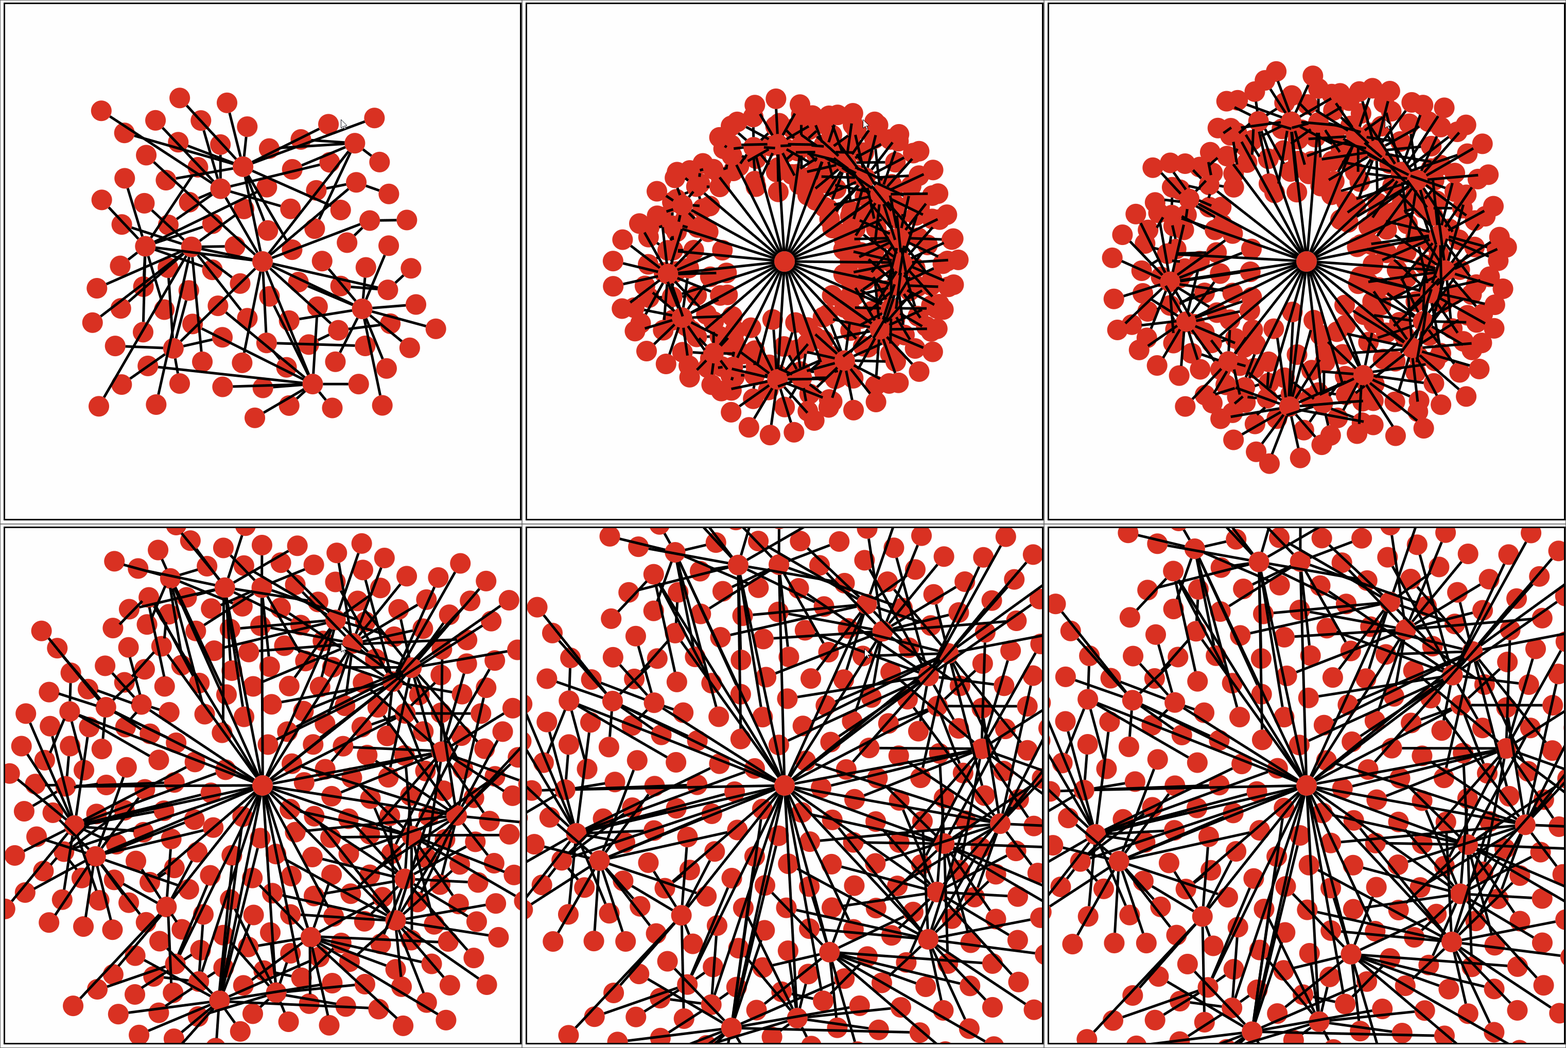
Single Root. Unknown Children/Grandchildren count. Using D3 transition.
Single Root. Unknown number of children. No Grandchildren.
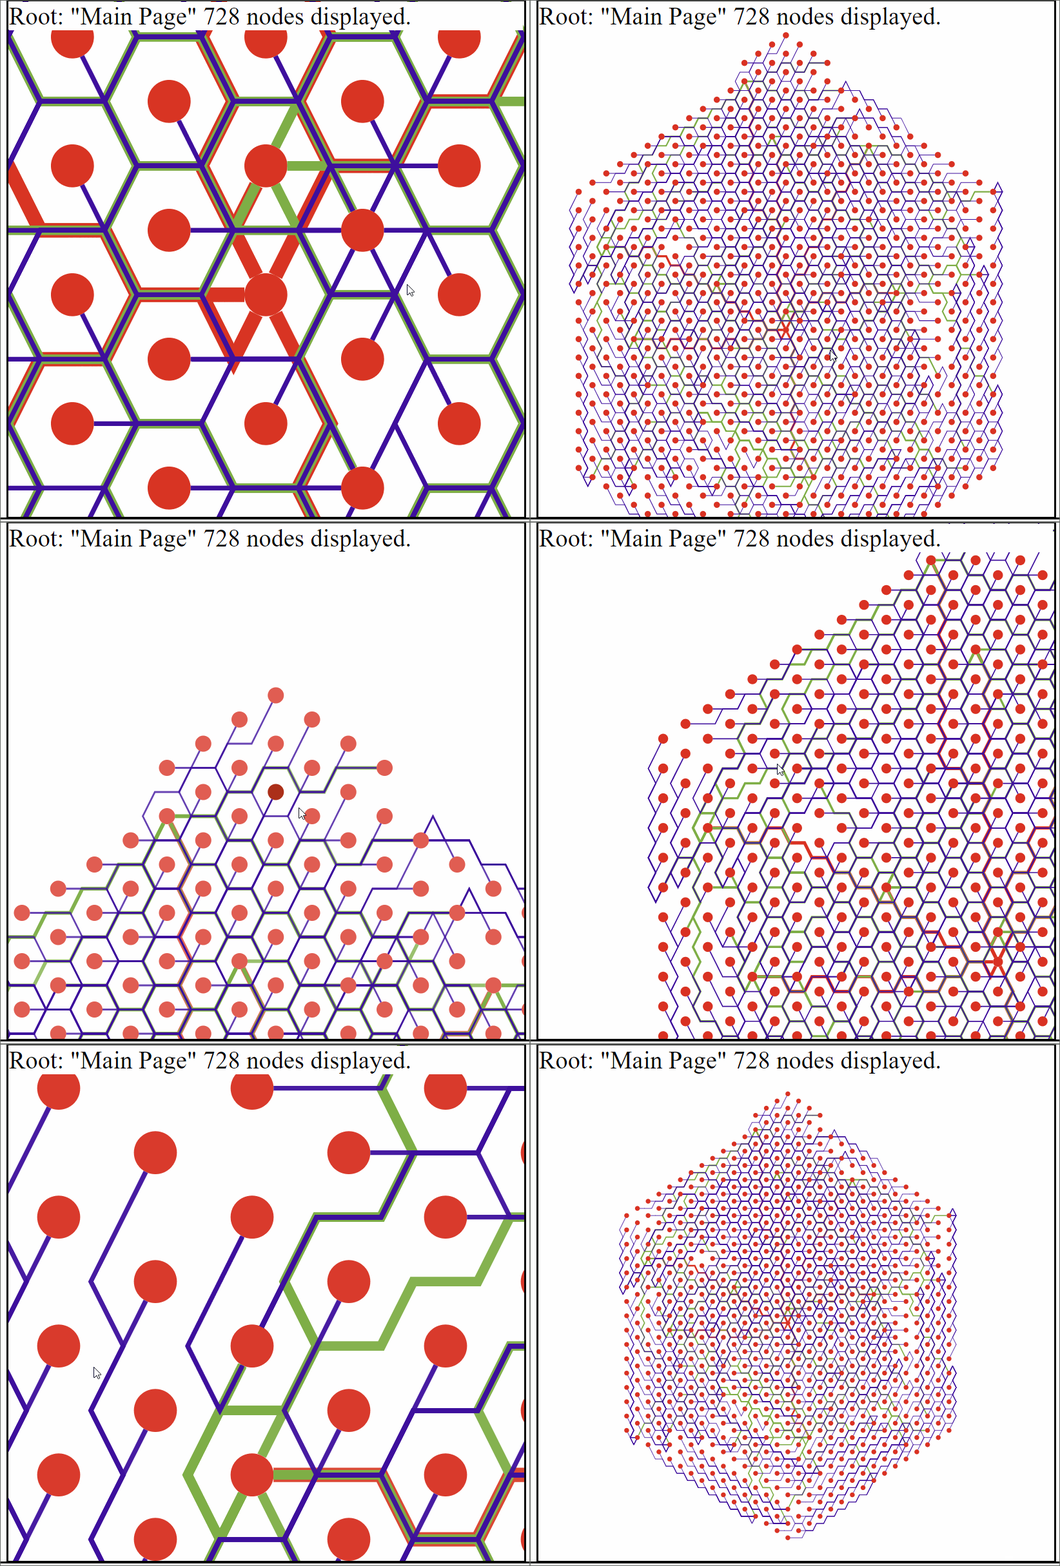
Example graph generated from data. Each vertex only has up to 10 children with the vertex farthest from the root only being 3 layers out. This was due to the amount of time it can take to generate.

Example of a path involving 50 Wikipedia pages. Path does involve some looping back to previously traversed pages.